
If you're running any form of performance marketing activity, chances are that you're doing it with the end goal of bringing in profit. You do this by bringing in as many conversions as possible for your brand, while keeping the amount you pay for each conversion (your CPA) somewhere below your profit per conversion, right?
This is the way that most of us think, either explicitly or implicitly, about performance advertising. The problem with it though is that it relies on the metric we call CPA, which is much less informative than it often appears on the surface. What might seem obvious, but what we also often forget, is that metrics like CPA are averages. Averages give us a top-line view of how much it's costing us to bring in users, but a top-line view can often miss things out.
Let's say that a channel brings in 10 customers for $100, giving it a $10 CPA. Sure, the average cost per acquisition is $10, but this tells us incredibly little about how much it cost us to bring in each of these customer. Just because the average cost per acquisition was $10 doesn't mean that any of these customers individually cost anywhere near $10 to bring in.
It's possible that the cost to acquire each customer looks something like the graph below, where we have customers on the x-axis, and the cost to acquire that customer on the y-axis.
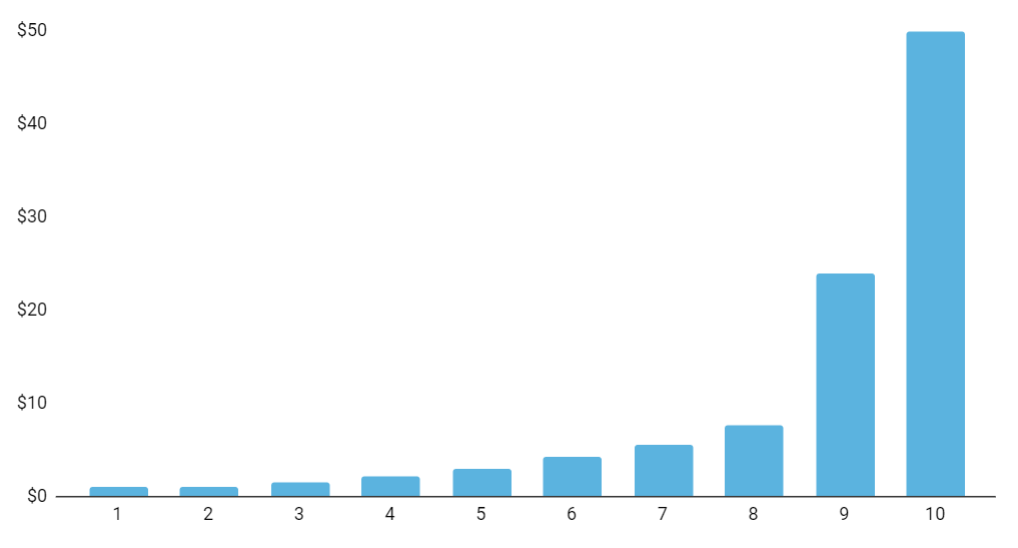
In this case, it appears we've spent significantly more to acquire customers 9 and 10 than we did for any of the preceding 8. This could be because we're targeting a saturated market, and though the first 8 customers were fairly cheap to acquire, the 2 after that required significantly more spend due to diminishing returns.
This might seem like an overly abstract example given that we're considering just 10 individual customers, but it's applicable to real life scenarios. Instead of representing 10 individual customers, the bars in the graph above could represent deciles (10% groupings) of the users that you acquire. Just as in the example above, it could be the case that you're paying significantly more to acquire the last two deciles (i.e. the last 20% of customers) than for the first 80%.
Where this example becomes interesting is when we start to think about margins. Here I'm using the term margin to refer to the amount of profit we make from a product or service, before taking advertising spend into account.
Let's say that, in our example, the margin on the product we're selling is $15. We might think that, if our average cost per acquisition is $10, then we're doing a good job. We're making $5 profit from each sale, so what's the issue?
The issue, as you might be able to guess, is that when we say we're making $5 profit from each sale, what we really mean is that we're making $5 on average from each sale. Some sales we're making more than $5, some we're making less.
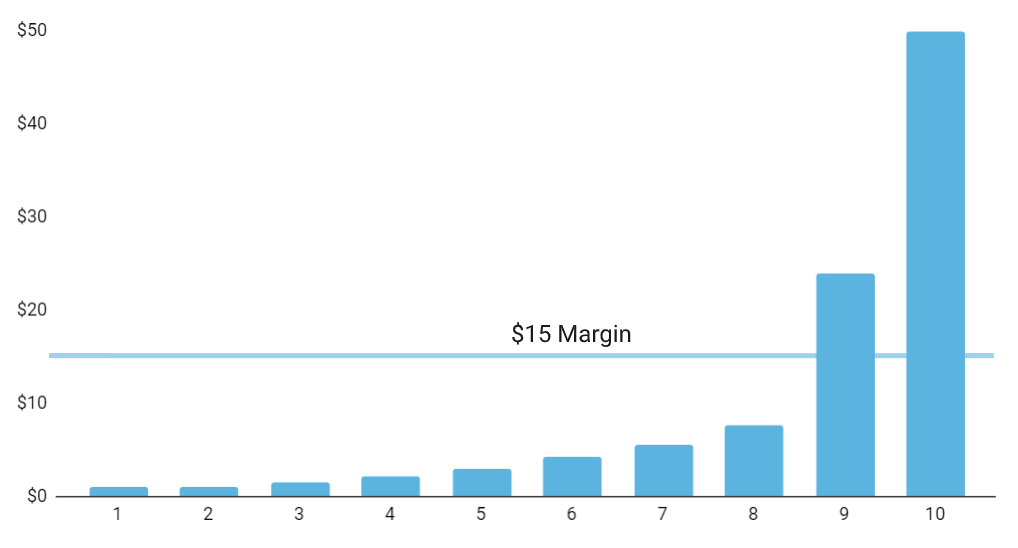
If we look at the graph with the margin drawn in, we can see that we're making a profit on users 1-8 (because they all cost less than $15 to acquire), but on users 9-10 we're actually making a loss. This is because the amount we're paying to acquire them exceeds the margin we make on them. Saying that we're making an average profit of $5 per sale hides the fact that we're losing money on some of these sales.
If we're losing money on customers 9-10, we ideally shouldn't be spending on them. In the example above, removing customers 9-10 actually changes our profit per customer from $5 to $11.75, and our overall profit from $50 to $94. By not acquiring these customers, who cost more to acquire than the margin they bring in, we've nearly doubled overall profit.
In theory this all checks out. If we could identify how much it costs us to acquire each customer, and could compare this to our margin per customer, the logical thing to do would be to only acquire customers whose margin is greater than their acquisition costs. Theory is one thing though, and practice another.
Putting this into practice#
Advertising platforms don't give you event-level data. That is, they don't tell you how much it costs to acquire individual users. Even if they were able to, they'd only be able to give you the amount you'd spent between customer acquisitions, and label this is as the acquisition cost of the later customer. This is arguably very different from telling you how much it cost to acquire that user.
What this means is that advertising platforms aren't going to give you data which will allow you create graphs like those above; the data simply doesn't exist.
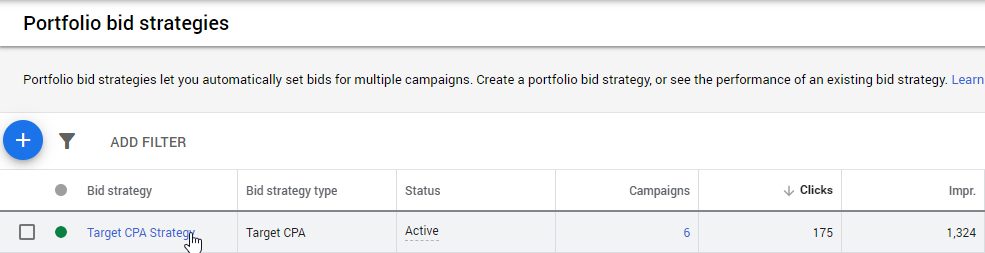
That doesn't mean that we can't get some understanding of how much it costs to bring in groups of users. The easiest way to do this is in Google Ads, if you're using any fully automated bidding strategy. If you head to the bid strategies section of the shared library, you should find your bidding strategies listed. Choose one which you'd like to look at, and click on its name.
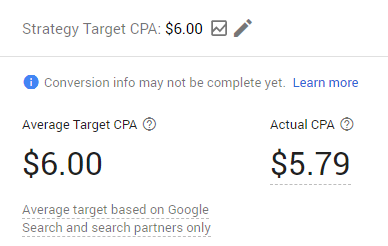
Next to your strategy's target, you should see a square grey graph icon. Click on this to open bid simulator.
In the screen that opens up next you should see estimates of how your bidding strategy would perform if it were given different targets. What's most interesting about this screen isn't the estimates themselves, but the relationships between them. Bid simulator not only tells us how many conversions, or revenue, we can bring in at different targets, but it also tells us the spend we'd need to hit that level of volume.
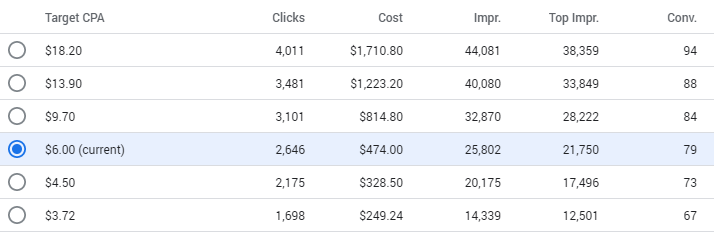
With all of this data, we're able to calculate a metric called a marginal CPA between each pair of estimates. A marginal CPA is how much it would cost us to bring in each marginal conversion, when comparing two scenarios.
Let's say that we're using a target CPA strategy and we're currently chugging along at 10 conversions a week, at a $100 spend, making our CPA $10. Perhaps the next volume estimate that bid simulator gives us is for 15 conversions a week at $300 of spend, making the CPA $20. Upping your target to $20 might seem like a good idea if your margin is $25. After all, if your CPA is below margin, you might as well bring in more volume, right?
To understand why upping targets to $20 isn't a good idea in this scenario, let's calculate the marginal CPA of adopting a $20 target CPA. CPA is spend divided by conversions, and so marginal CPA is marginal spend divided by marginal conversions. Our marginal spend is $200 ($300-$100) and our marginal conversion volume is 5 (15-5). Dividing the former by the latter, we get a marginal CPA of $40.
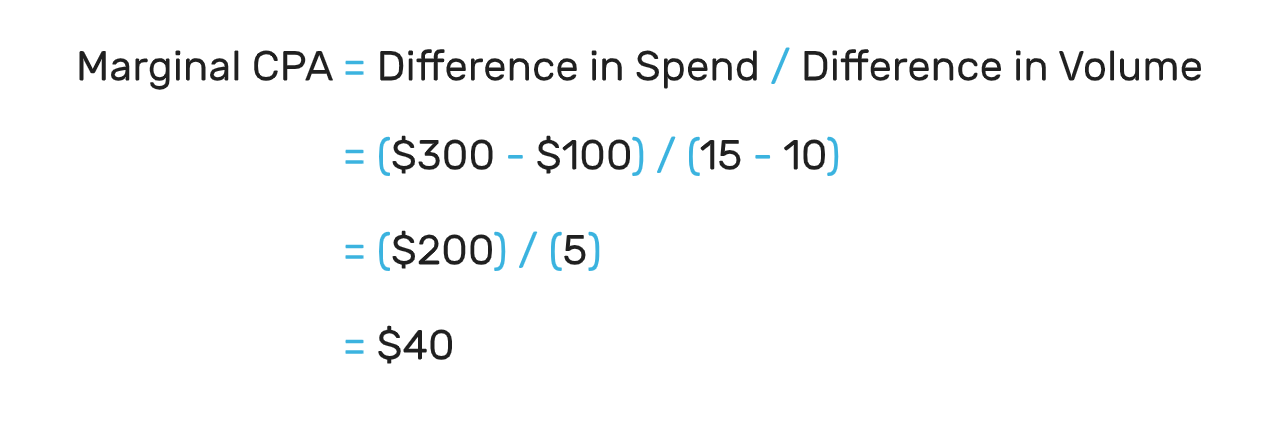
This means that if we were to raise our CPA target to $20, we'd be paying $40 for each additional conversion we're bringing in. $40 is safely over our margin of $25, and so we should avoid raising our target. Doing so would be losing us an average of $15 on each additional conversion that we bring in.
Here we have an example of where looking at CPA alone doesn't tell us the full story. If we just looked at CPA, we'd be tempted into increasing targets. Looking at the marginal CPA between the two targets tells us that this will actually lose money, and is something to be avoided.
How accurate is bid simulator?#
How accurate the above method is depends entirely on the accuracy of bid simulator. If the bid simulator estimates are inaccurate, the marginal CPA estimates will be too. So, can bid simulator be trusted?
If you believe Google's comms on how bid simulator works, its outputs should be fairly reliable. Bid simulator works by storing data on every auction your campaigns entered in the last 7 days. By storing the auction conditions, bid simulator is able to re-run the auctions, and simulate what would've happened if you'd entered those auctions with a different CPA target.
Because Google knows your conversion rates, and how conversion rates are likely to differ on an auction-by-auction basis, it can then estimate how many clicks, and therefore conversions, you would've won if you'd had a different bidding strategy target set.
Based on the above, I've always been happy to treat bid simulator estimates as fairly reliable. The only exception to this is where you have little volume flowing through your bidding strategy. In this case, the estimates that bid simulator provides are likely to be less reliable.
A good way to check whether you have sufficient data to trust bid simulator's estimates is to look at how many different estimates bid simulator gives you when you open it up. If it only provides 2 or 3 volume estimates, those likely won't be as reliable as if it provides you with 10 or more estimates.
Beyond bid simulator#
If you're using manual bidding, and don't have access to strategy-level volume estimates, or you're using a different channel entirely, there are still ways that you can calculate marginal CPAs. The method I'm going to outline below uses Facebook as an example, but it's equally applicable to any other channel.
To calculate marginal CPAs, we want to know how much it'll cost us to bring in each marginal conversion. One way we can estimate this is by breaking our performance reports down into the most granular level, which for Facebook is the ad level, and seeing how much marginal volume each ad brings in.
We can do this by downloading an ad level report from Facebook over a reflective time period. By 'reflective', I mean a time period in which CPAs are stable, and reflective of what you want to forecast. If you want to produce a monthly forecast, then pull a month's worth of data. The ad level report should contain spend and conversions, which you can then use to calculate the CPA of each ad. You should remove any ads with 0 conversions.
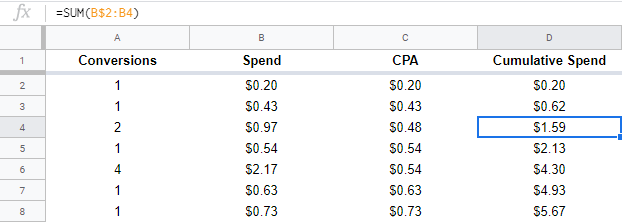
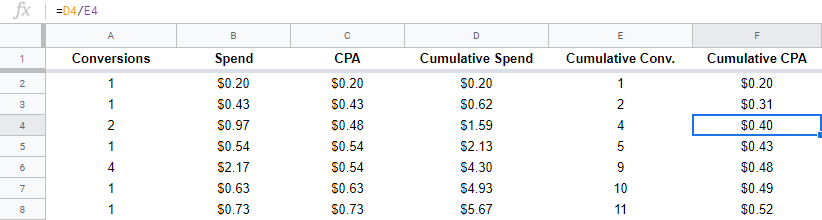
We're then going to sort the ads by CPA, from lowest to highest, and add in three more columns. The first of these columns will be called cumulative spend, and will sum up the spend of all ads from that row upwards. For example, the first row's cumulative spend will just be that row's spend. The second row's spend will be that row's spend added to the above row, and so on.
Next to this we're going to make a column called cumulative conversions. This behaves exactly the same as cumulative spend; it sums up all conversions on ads in that row and above.
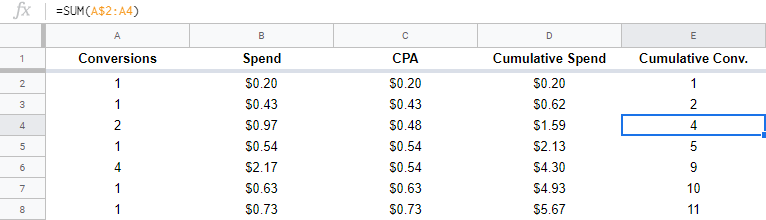
Once you have these two columns in place, it's time to add a final column, cumulative CPA. This is simply the cumulative cost divided by the cumulative conversions.
Once you have your cumulative CPA you effectively have volume estimates for all the different CPAs you could aim for. Or, if you view it the other way around, you have CPA estimates for all the different volumes you could aim for.
If you choose any two volume estimates, you can work out the marginal CPA between them by dividing their difference in spend by their difference in conversions. Often the marginal CPA can come out much higher than the actual CPAs, which can be a sign that you should revise downwards your CPA targets.
For example, let's say two of your rows are:
- Cumlative Spend = $1000
Cumulative Conversions = 100
Cumulative CPA = $10 - Cumulative Spend = $1500
Cumulative Conversions = 105
Cumulative CPA = $14.29
If we try to calculate the marginal CPA between these two rows, we get:
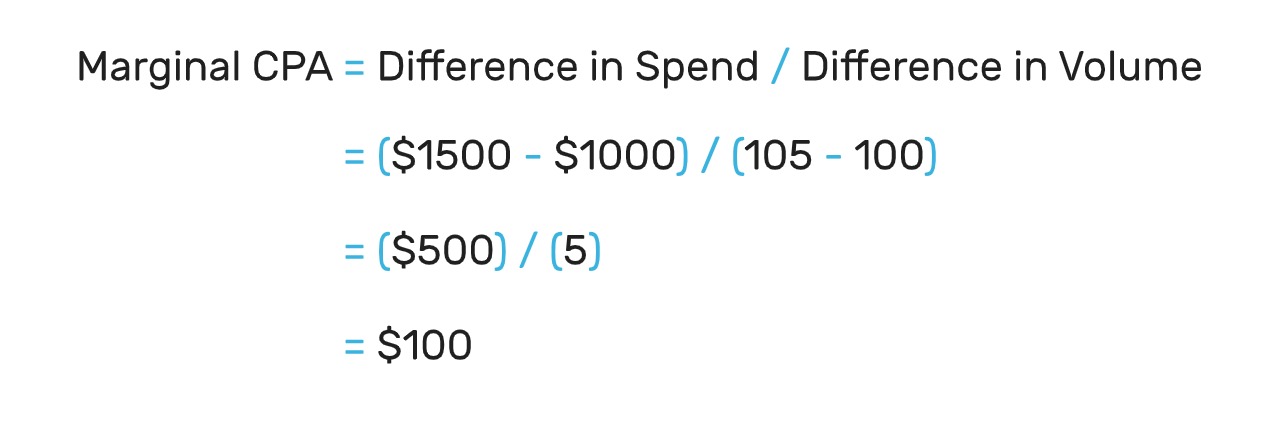
Despite our CPA only rising by $4.29 between the two scenarios, we see that our marginal CPA here is a huge $100. Unless our margins are higher than $100, it wouldn't make financial sense to bring in the extra 5 conversions by raising our CPAs to $14.29.
This method is good for forecasting CPAs and volumes that are below, or close to, your actual CPAs. This is because it works off your account data, and so has more data on how much volume you can bring in when your CPAs are in this range. It's less good though at forecasting what your CPAs would look like for significantly higher volumes, or what your volumes would look like for significantly higher CPAs, because it has less data to go off here.
One way around this is to extrapolate the figures that this method gives you. You could do this by plotting a scatter graph of cumulative spend against cumulative conversions, and plotting a line of best fit. If you take the equation of the line of best fit, you can use this to estimate what your costs will be for any volume that you so choose, which in turn allows you to calculate the CPA you need for that volume.
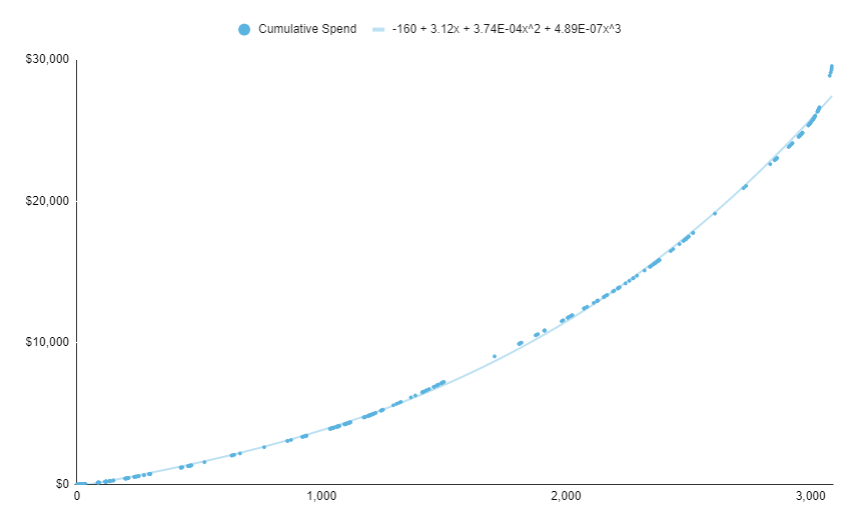
If you're feeling mathematical, you can in fact differentiate that equation to give you the change in cost with respect to conversions, which is effectively what a marginal CPA is. If you know your margin, you can plug your margin into that equation and solve. The result of this will be the number of conversions you can generate in the time period which your report covers (e.g. a month) without expecting to pay an amount over your margin for any of them. This is a rough estimate, but it's essentially what we wanted earlier, when we talked about not paying above the margin for any individual customer.
This method of calculating volume estimates, and marginal CPAs, works on any channel. You simply have to download the most granular report that channel allows, and follow the steps above. It even works on search in the case that you're not using fully automated bidding, and so can't access bid simulator across your campaigns. In this case, you can follow the approach above just by downloading a keyword-level report.
To wrap up#
When it comes to deciding what targets you should aim for, the approaches outlined above are much better than just looking at a CPA. A CPA is an average, and in being an average it tells you nothing about how much you're paying to acquire individual customers. By understanding that some customers cost significantly more than others to acquire, and by using marginal CPA to proxy this, you can get a much better picture of what you're getting from your marketing.
Understanding what your marginal CPAs are could tell you that they're lower than you expect, and thatyou can afford to bring in more customers while increasing overall profits. What more commonly happens though is that marginal CPAs are in fact higher than you might anticipate, and by appreciating this you can actually increase profits by pulling your CPA targets back.
-
**Before you go...
**If you've made it this far, and you're interested in marginal CPAs, I'd genuinely love to hear from you. Marginality is an under-explored topic in marketing, and I really want to learn how marketers are approaching and thinking about it currently. In return, I'm happy to share my thoughts and be helpful in any way I can.I'd love for you to contact me here.