
If you've run digital advertising campaigns for a number of years, you'll likely have noticed that ad prices have a tendency to increase over time.
Answering why this happens is fairly straightforward. As advertisers see good results on a platform, they increase their volumes. New advertisers join in, increasing competition. As most platforms sell ad space via an auction mechanic, the increase in advertiser demand pushes up prices.
Though the idea that ad prices increase over time is hardly surprising, I've never seen any attempts to forecast exactly how much they'll increase in a given period. This post sketches out a rough guide to how you can predict changes in ad prices over the coming years.
Supply & Demand#
To understand how we'll forecast changes in ad prices, we first need to hone in on the fact that ad prices are effectively set by rules of supply and demand.
Supply in this case refers to the number of users on a platform, as this determines how many ad spaces are available to sell, and demand refers to the amount that advertisers are willing to spend on buying those ad spaces.
Of course it's impossible to give precise values for supply and demand for a platform using just publicly available data, but there are ways we can proxy them. One such proxy is to look at figures that an ad platform discloses in its earnings reports.
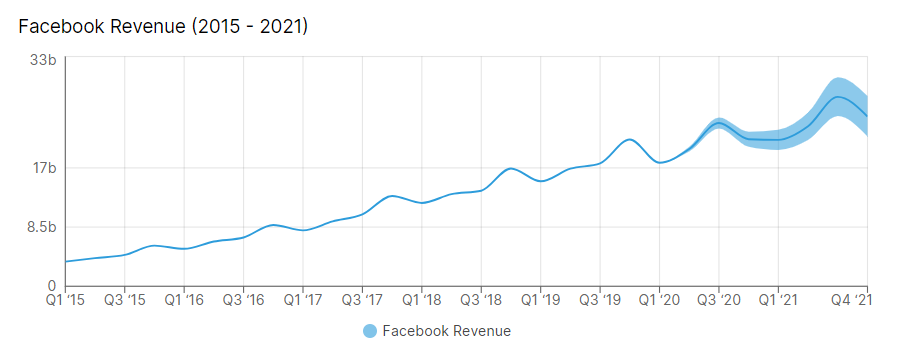
Take Facebook for example. Facebook discloses its ad revenue in its earnings reports, and also usage metrics like DAUs (daily active users). Ad revenue is a proxy for demand, and DAUs are a proxy for supply.
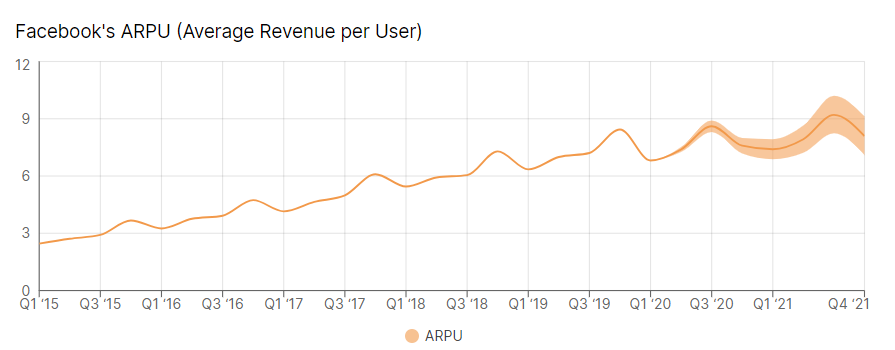
The ratio between these numbers is known as the platform's ARPU (average revenue per user) or ARPDAU (average revenue per daily user).
ARPU is an important metric because it tells us how well a platform is able to monetise its users. As such, it's also acts as an effective proxy for how intensely advertisers compete to reach users. A high ARPU suggests that advertisers are willing to pay large amounts to reach users, leading to higher ad prices, and vice versa.
Because ARPU is a good proxy for ad prices, we can use changes in ARPU as a way to estimate changes in ad prices. Remember our expectation from earlier that ad prices increase over time? We can support this belief by showing that platforms like Facebook have seen their ARPU steadily increase over the past five years:
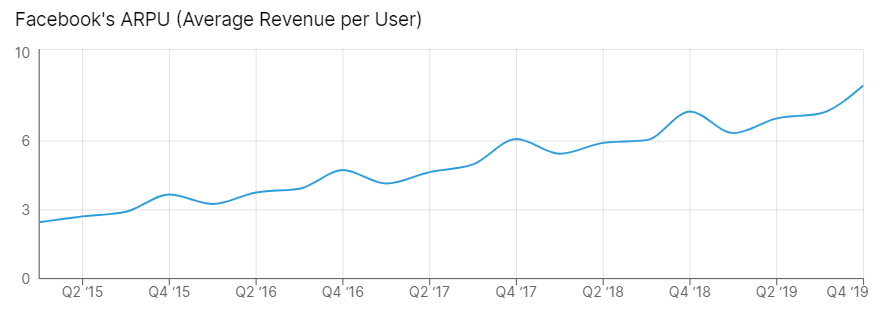
What's important to note is that the absolute value of ARPU can't tell us anything about ad prices; We can't directly go from an ARPU to a CPM (cost per thousand impressions).
Though the absolute values of ARPU aren't particularly helpful, relative differences in ARPU can give us an estimate of relative differences in ad prices. For instance, Facebook's overall ARPU increased roughly 243% in the last 5 years, suggesting a roughly similar increase in ad prices in that time.
Though Facebook doesn't make aggregate ad price data publicly available, this 243% increase is (I think) roughly inline with what most advertisers would have expected in that timeframe.
I'll concede here that this is far from an exact science. A lack of public data on ad prices means we can't test how closely ARPU follows ad prices. If we want to predict future ad prices though, we don't have much of a leg to stand on if we aren't willing to use ARPU as a proxy.
This, I'd argue, is what we should do. We should be willing to use ARPU as a rough proxy for forecasting changes in ad prices over time. It won't be a perfect guide, for reasons that I go into more at the end of this post, but it's the best guide we have.
Forecasting Future Ad Prices#
The way we're going to forecast future ad prices is by forecasting ARPU. We're not going to do that directly, rather we're going to break ARPU down into revenue and usage numbers, forecast both of those independently, and then divide the results to come up with an ARPU forecast.
To do this, let's start with user numbers. Facebook release usage numbers quarterly. If we plot the data for the last 5 years worth of earnings reports, we get the following:
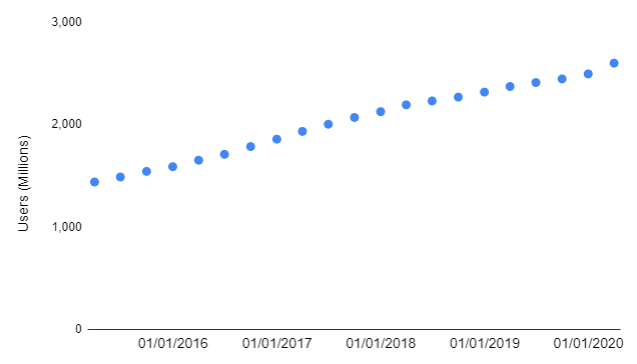
Though there are some slight upticks around the start of 2018 and the start of 2020, the user growth is largely linear. We can capture this by fitting a linear line of best fit to the data as follows:
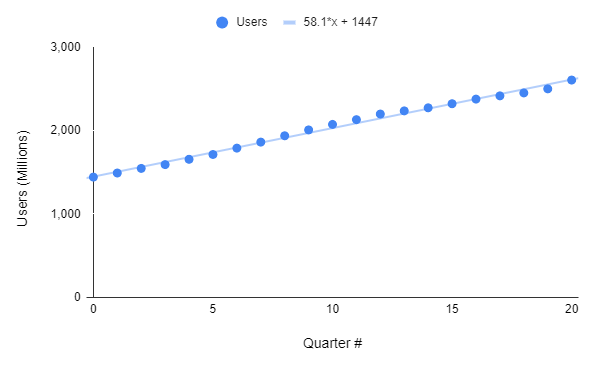
Note that here I've replaced the x-axis with Quarter #. This simply counts the number of quarters since the start of our time period (2015Q1), and is done to make our equation (users = 58.1 * Quarter# +1447) easier to work with.
This equation is obviously just a very rough estimate, and it won't come close to letting us predict usage numbers far into the future. That said, it will be useful for estimate usage data for data points just out of sample, i.e. for the next few quarters.
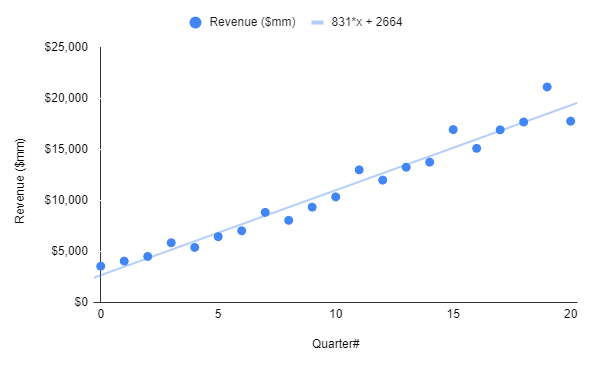
Now that we have a way to forecast usage data into the future, what about revenue? Revenue is a little bit trickier, which we can see if we plot a graph of Facebook's quarterly revenue for the past 5 years:
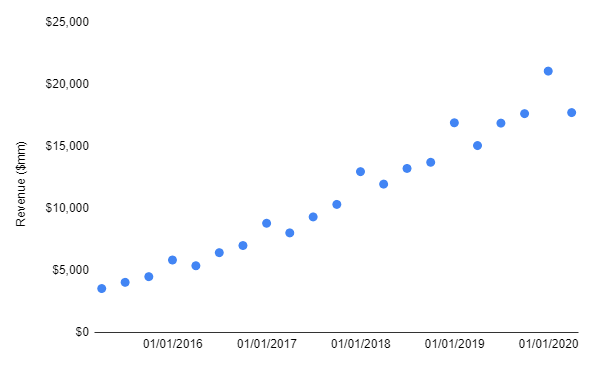
Though the historical revenue data shows a clear upward trend, it's nowhere near as neat as it was for user growth. If we plot a linear model to it, we can see that there's a fair amount of deviation from that model:
Fortunately, there is a reason for some of this. In the graph below, the green dots represent Q4 of each year:
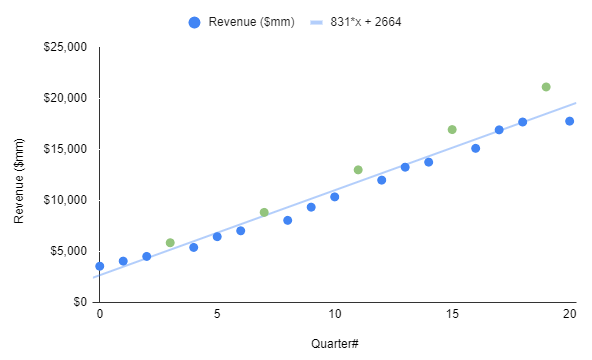
As with most ad platforms, Facebook's revenues rise substantially in Q4 due to increased consumer spending (and hence advertiser demand) in the period from Black Friday to Christmas.
We can actually calculate an estimate of how much Facebook's revenue rises or falls based on the quarter, by finding the average percentage difference between our line of best fit, and the actual revenue values for each quarter. If we do this we get something like the following:
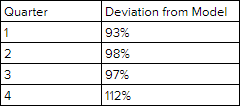
What this is saying is that, during an average Q4, Facebook's revenues are 12% above what you might if you used a regular linear model.
The percentages sum to 400% and average out at 100% as we'd expect, and shows that our values are correctly normalised.
Putting this into a model#
Now that we have some rough way to predict how Facebook's revenue and usage numbers might increase in the next couple of quarters, we can start to put these methods to practice.
To do this, I've used a forecasting tool called Causal. In Causal I created variables for both Facebook's DAUs and revenue, populating historical data for past quarters, and using our equations above to populate future quarters. The user growth projection looks like this:
Note that the projection includes an amount of uncertainty for future quarters. This is why the line appears to broaden past the start of 2020.
For the revenue projection, I took our linear model and multiplied its prediction based on the quarterly seasonality data we found earlier. Put simply, I multiplied the revenue projection by 0.93 for quarters that were in Q1 of that year, 0.98 for Q2, and so on. This is the result:
Again I've added a growing amount of uncertainty to the revenue projection as we move further into the future.
Now that we have projections for both user and revenue growth, we can divide these by one another to get a projection for ARPU:
And so there we have it, a projection of Facebook's ARPU for the next two years.
Bear in mind what we said earlier though, that the absolute values of ARPU don't translate directly into ad prices. Rather, it's the relative differences in ARPU that should translate into relative differences in ad prices.
With that in mind, lets divide all points on the ARPU graph above by the ARPU for 2020Q1, the last quarter for which we have historical data:
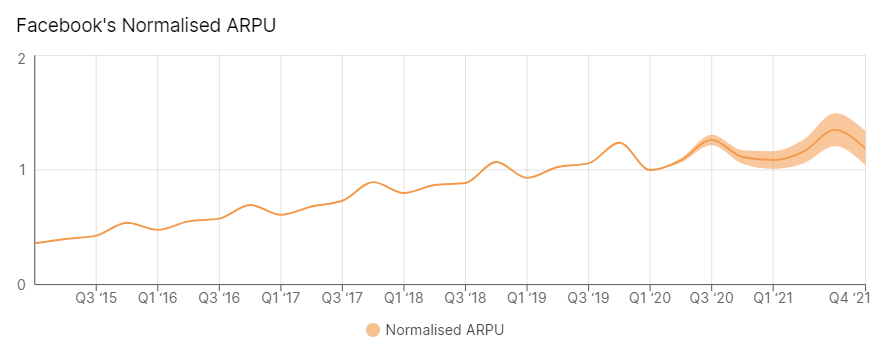
What we now have is a graph of Facebook's normalised ARPU; ARPU normalised to its current value. A value of 1.2 on this chart, for example, represents an ARPU 20% higher than current.
Now if we assume that relative differences in ARPU correspond to differences in ad pricing, our normalised ARPU curve should give us a rough estimate of how ad prices will change in future.
If we want to know how much more expensive ads will be on Facebook's ad platform in 2021Q1, we can simply read off the normalised ARPU projection for that quarter.
Causal actually lets us plot distributions for each point on a time series projection. If we do this for 2021Q1, the projected ARPU distribution looks as follows:
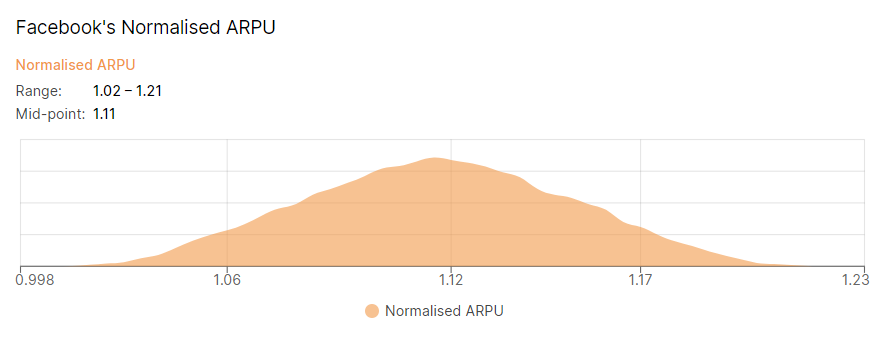
What this is effectively telling us is that, a year from now in 2021Q1, Facebook ad prices are likely to be between 2 - 21% higher than they currently are, with a mid-point increase of 11%.
And there we have it. By projecting Facebook's ARPU forward and normalising it, we have an extremely rough guide on how to project ad prices into the future.
Interested in playing with my model? You can clone its template here.
Limitations#
To close off, it's worth pointing out that the methodology described above has more than its fair share of limitations.
The first comes from the fact we've used linear projections for both revenue and usage. These both essentially assume that the future looks a lot like the past. But what might be less obvious is that they're dependent on what you consider as 'the past'.
I chose to use the last five years worth of data to build a projection of both usage and revenue, and that projection would no doubt have looked different if I'd used a shorter or longer period of time.
I chose five years because growth of both of those metrics has been fairly stable in that time, and because Facebook's ad platform (and with that, Facebook's revenue) only really started to take off about five or six years back. This last point is important, because if I'd taken a period of time longer than five years it would have been tempting to fit an exponential curve instead of a linear one. I chose not to do this because it would have led to some improbably predictions for future ad prices.
By using a linear fit, and by effectively assuming the future will look a lot like the past, I've ignored events like the Coronavirus outbreak having a significant impact on the future of ad pricing. I'm okay with this not because I think that the outbreak won't impact pricing, but because how much it impacts pricing is anyone's guess. Rather than just take a stab at guessing Coronavirus' impact, I've just left it out.
The other big assumption I made in the working above is assuming that ARPU is actually a good predictor of ad prices. Or, to put it more precisely, it's the assumption that relative differences in ARPU are indicative of relative differences in ad prices. Because Facebook don't release any data around global ad prices, there's no easy way to validate or invalidate this assumption.
While you might feel uncomfortable using assumptions that we can't numerically validate, I think we need to be realistic. If we're producing forecasts for our campaigns that look a year or so into the future, rises in ad pricing are something we need to take into account. The method I've outlined above is far from fool-proof, but it does get us somewhere. Given that we don't have any other reliable methods for predicting ad prices, I think we should be happy to run with the method outlined in this article, even if it's not a silver bullet.