
Let's say you're looking to launch a new paid search campaign. It could be a new campaign for an existing brand, or you could be launching a brand on paid search for the first time. Better still, you might not even have a brand yet, and just want to understand what the search market is like for a particular idea.
If you're in any of these situations, there's an approach you can take to validate your strategy before you launch. It's not obvious - I've never seen it written up - but it can give you a fairly good idea of how efficiently you can run your campaigns.
To understand the approach, we have to say a few words about Keyword Planner.
Keyword Planner#
If you're not already familiar with Keyword Planner, it's a free tool within Google Ads that lets you pull search data for any keywords you like.
Once you've navigated to Keyword Planner, you'll want to create a plan that contains all the keywords you plan on bidding on.
You can find these keywords either by entering an initial keyword idea (e.g. running shoes) or by entering a relevant site (e.g. nike.com/running). Whichever of these routes you take, you'll be presented with a list of popular keywords. You can pick and choose which of these you want to add to your plan, however you should only add keywords that you actually intend to bid on.
Once you've built your plan, you'll want to head to the Keywords section of keyword planner. You should see something like this:
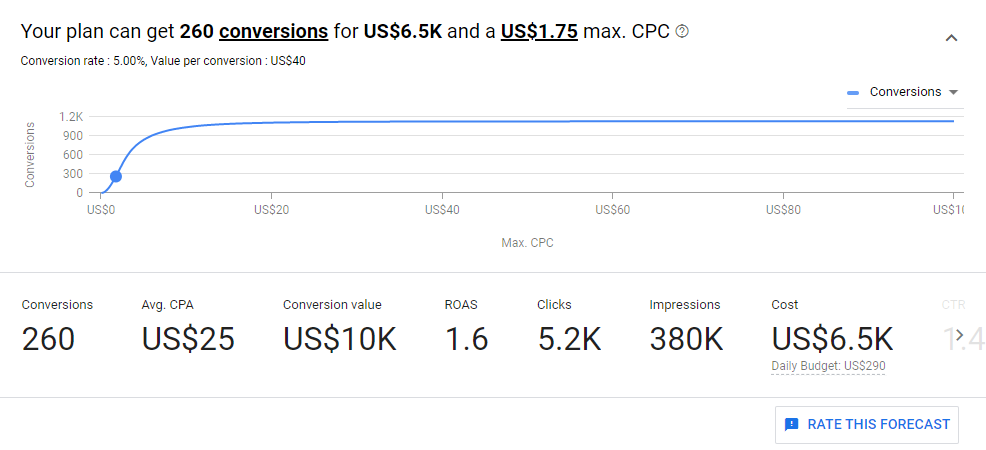
What this is essentially telling you is that, based on a $1.75 cost per click bid, you can expect to achieve a certain set of metrics by bidding on these keywords. You can click on the bid to change it, and see how the metrics change in response.
Now, the really interesting thing about this data isn't so much the data itself. Knowing a set of output metrics for an input bid is nice, but it's nothing special.
Where it gets interesting is when we try to understand the equation that sits behind the data. To get at this, we're going to effectively scrape a bunch of data points from this tool, and try to reconstruct this equation.
The way I do this is to create a Google Sheet with a bunch of different bid levels, like so:
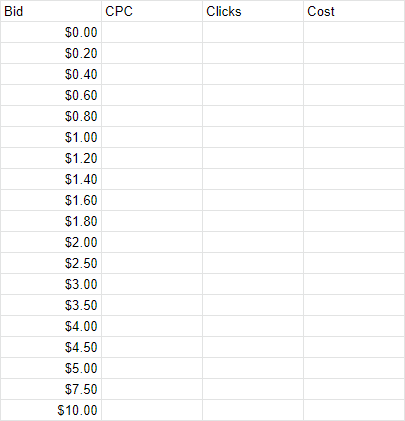
We're then going to input each of these bids into Keyword Planner, and note down what the actual CPC and Click projections come out as. We can then multiply these together to get Cost.
It's a slightly laborious process pasting these all in, but when you've done it you should end up with something like the below.
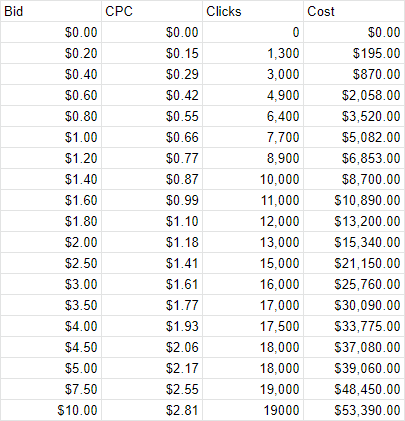
Things to note are that:
- Trivially, a bid of $0.00 will get you no clicks at all.
- The intervals between bids get larger as the bids increase. This is simply because the incremental difference in clicks gets progressively smaller as you increase your bids; your volume is no longer being limited by your bid, but rather by total available search volume. As such, we don't need as much granularity at the higher bid levels.
Now that we have this, we can plot a scatter graph of Clicks against CPC. It should look something like this.

To understand the relationship between Clicks and CPC, we can perform a regression analysis/add a trendline to the scatter graph. Here I've chosen to use a 2nd order polynomial (i.e. a quadratic equation):
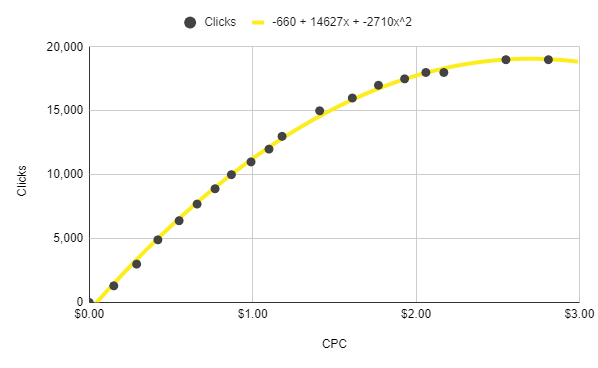
The equation of the trendline is displayed at the top of the graph.

Before we go any further, I should clarify two limitations of plotting this trendline:
-
**It's not going to be accurate at CPCs close to $0
**You can see on the graph that the x-intercept (where the line crosses the x-axis is at a CPC slightly above $0.00. We know in reality that the graph should go through the origin, because a $0.00 CPC will get you 0 clicks. As a result, we know not to trust the equation for values of CPC very close to $0.00. -
**The trendline doesn't extend to CPCs past about $2.70
**On the right hand side of the graph, we can see that the line starts to drop as CPCs approach $3. We're going to ignore this section of the graph, and say that our equation only applies for CPCs in the region between $0.00 (but not too close to $0.00) and $2.70.
So, what do we have? We have an equation which describes how many clicks we can get for different CPCs in the range of $0.00 to $2.70.
Why is this useful? Well, if we know how many clicks we can get for a particular CPC then, provided we have an estimate of our conversion rate, we can also estimate how many conversions we'd get for a particular CPC.
If we know our margin (i.e. profit) per conversion, we also know how much profit we can generate at a particular CPC.
We can express this by writing our earlier equation as:
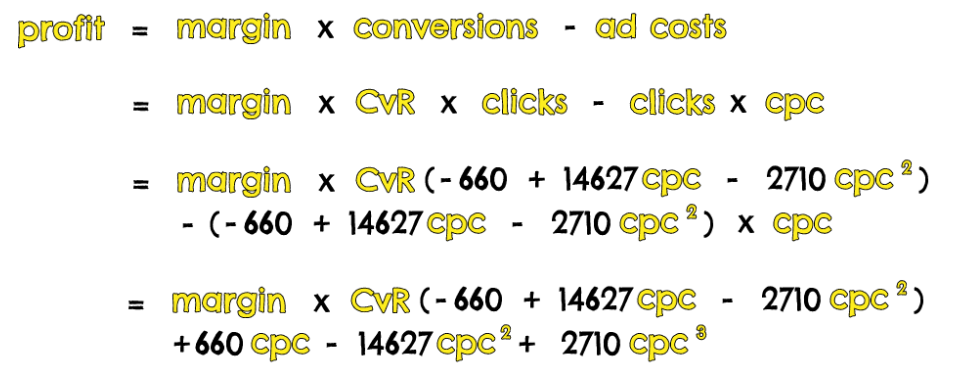
Where we’ve substituted in our earlier equation for clicks in the third line. Bear in mind that our margin (our profit per conversion) and our CvR (our conversion rate) are assumed to be constants.
Now let’s ask the question, what’s the maximum profit we can generate?
The Calculus#
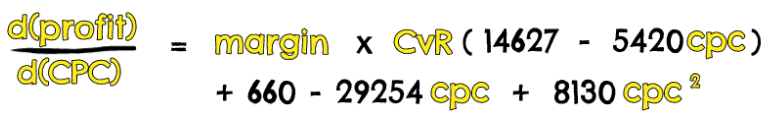
To answer this we’re going to try and work out the value of cpc that gives us the maximum profit. We can do this by differentiating our above equation with respect to cpc, and finding the relevant stationary point.
This is a value of cpc at which any infinitesimally small change either side (i.e. increasing or decreasing the cpc) will lead to no change in profit. This makes it the point at which profit is at its maximum.
We can differentiate our earlier equation for profit as follows:
We’ll plug in some values for margin and CvR just to make things simpler. Let’s say that they’re $50 and 5% respectively. We can simplify as follows:
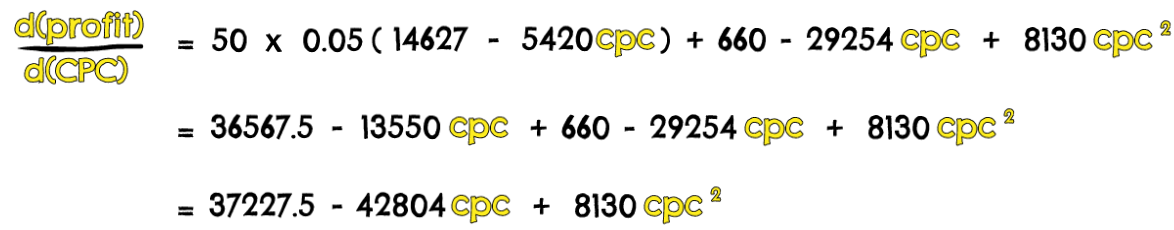
Now to find the stationary points, i.e. the points at which profit is at a maximum, we simply set the left hand side of the equation to zero. This is equivalent to saying that we’re looking for the peak of the graph that the above equation gives.

If we go through and solve this equation, we find that there are two values of cpc for which the above equation holds true:

We’ve got two solutions i.e. two values of cpc which apparently maximise our profit. In reality we can discard the second value, because as we said earlier, the trendline we plotted is only valid for values of cpc below around $2.70. Anything above that and we ignore the data.
So, what this is saying, is that we can generate the maximum possible profit by hitting a $1.10 CPC. A look at our bid chart up above indicates this corresponds to a $1.80 bid.
Working out the profit#
If we want to understand how much profit this would actually generate, we can plug the $1.10 cpc value into our profit equation from earlier:

If we add all of our values in here and do the maths, we end up with:

Remember that, because our original keyword planner data was monthly, the above represents the maximum monthly profit we could generate (with a $1.10 CPC, $50 margin per conversion, and 5% CvR).
In summary#
That, essentially, is how you validate a paid search strategy.
To recap, we:
- Built a plan in Keyword Planner, using search terms relevant to our product.
- Pulled CPC and click data at a range of different bid levels, and used the points to work out a relationship between CPC and clicks.
- We worked this into an equation for profit, and differentiated it to understand how profit changed with CPC.
- We set this differential to zero, and solved, to find the value of CPC at which profit is maximised.